This release is the result of three months of development, implementing those new features, and fixing bugs.
Release Highlights:
If you are upgrading from a previous version, there are no mandatory changes in SQL schemas, configuration, API commands or hooks. However new
mod_invites
uses a new table in databases, see below.
Other contents:
Below is a detailed breakdown of the improvements and enhancements:
Database Serialization
This feature adds new way for migrating data between
database backends
by exporting data from one backend to a file and importing that into different backend (or possibly to same backend but on different machine).
Migrating data using this can be executed by first exporting all data with
export_db
command, changing configuration of ejabberd and switching modules to use new database backend, and then importing previously exported data using
import_db
command.
This mechanism works by calling those new command from ejabberdctl, for exporting data:
-
ejabberdctl export_db <host name> <path to directory where exported files should be placed>
-
ejabberdctl export_db_abort <host name>
-
ejabberdctl export_db_status <host name>
and for importing:
-
ejabberdctl import_db <host name> <path to directory with exported data>
-
ejabberdctl import_db_abort <host name>
-
ejabberdclt import_db_status <host name>
Exporting and importing work in background after starting them from
ejabberdctl
(commands executed by ejabberdctl have time limit for how long they can work, with this setup there should be not issue with export or import getting aborted by that), and current progress of background operation can be tracked by calling corresponding
*_db_status
command. Operation in progress can be also aborted by executing
*_db_abort
command.
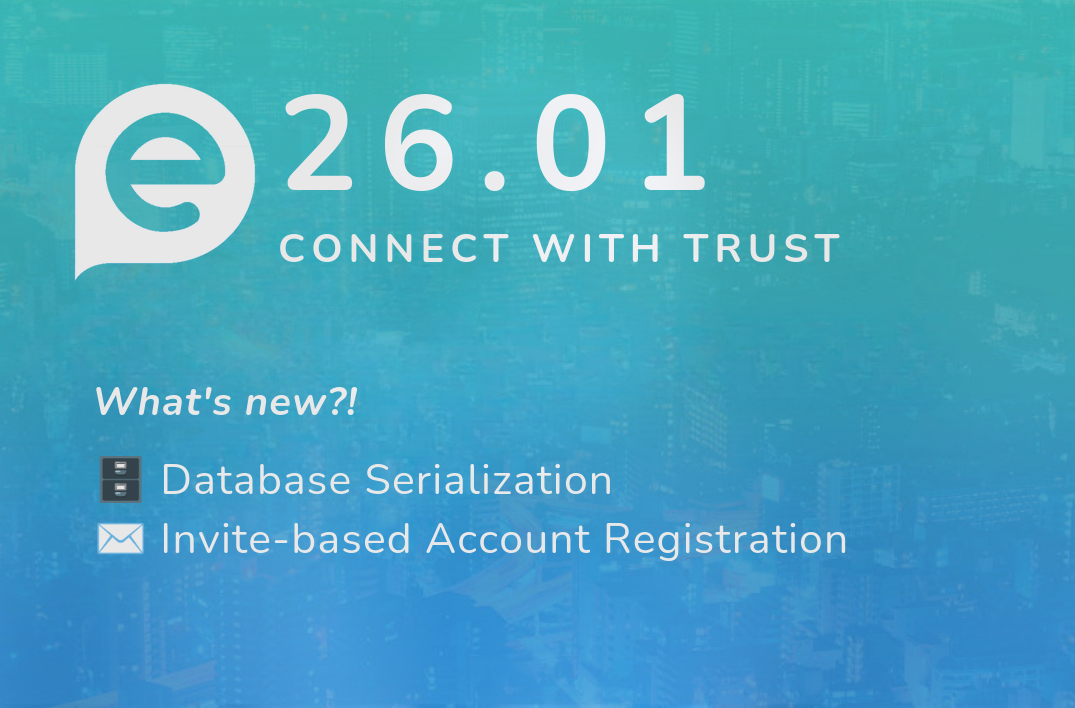
Roster Invites and Invite-based Account Registration
Until now the canonical method to register an account in ejabberd was to let anybody register accounts using In-Band Registration (IBR) (
mod_register
) or Web Registration (
mod_register_web
), and then try to limit abuse with access limitations or
CAPTCHAs
. Often this process got abused, with the result that account registration had to be disabled and rely on manual registration by administrators.
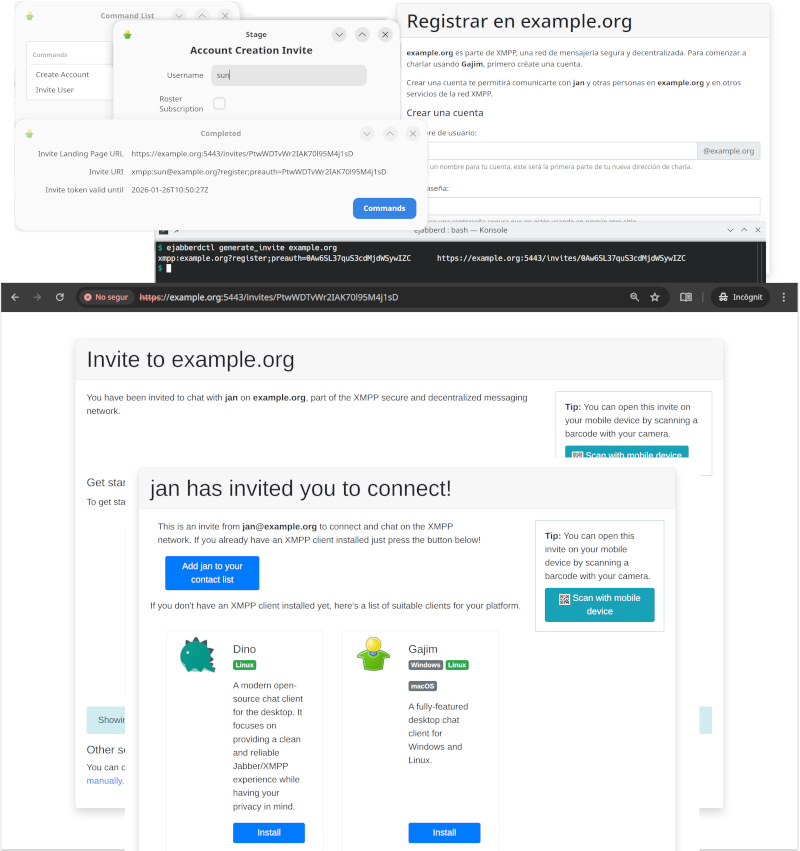
The new
mod_invites
implements support for invite-based account registration: administrators can generate invitation URLs, and send them to the desired users (by email or whatever). Then the user that receives an invitation can visit this invitation URL to register a new account.
On top of that,
mod_invites
lets you create Roster Invites: you can send a link to some other person so they can connect to you in a very user-friendly and intuitive way that doesn&apost require any further interaction. If account creation is allowed, these links will also allow to setup an account in case the recipient doesn&apost have one yet.
Relevant links:
Quick setup:
-
If using SQL storage for the modules and have disabled the
update_sql_schema
toplevel option, then
create manually the SQL table
, see below.
-
If you plan to use the landing page included with
mod_invites
, install JavaScript libraries
jQuery
version
3.7.1
and
Bootstrap
version
4.6.2
. This example configuration will assume they are installed in
/usr/share/javascript
. The
ejabberd
container image already includes those libraries. Some quick examples, in case you need some help:
-
Debian and related:
apt install libjs-jquery libjs-bootstrap4
-
AlpineLinux and other operating systems where you can install
npm
, for example:
apk -U add --no-cache nodejs npm ca-certificates

npm init -y \
  && npm install --silent jquery@3.7.1 bootstrap@4.6.2

mkdir -p /usr/share/javascript/jquery
mkdir -p /usr/share/javascript/bootstrap4/{css,js}
cp node_modules/jquery/dist/jquery.min.js /usr/share/javascript/jquery/
cp node_modules/bootstrap/dist/css/bootstrap.min.css /usr/share/javascript/bootstrap4/css/
cp node_modules/bootstrap/dist/js/bootstrap.min.js /usr/share/javascript/bootstrap4/js/
-
Generic method using the included script:
tools/dl_invites_page_deps.sh /usr/share/javascript
-
Configure ejabberd to serve the JavaScript libraries in path
/share
; serve mod_invites in any path of your selection; and enable mod_invites with some basic options. Remember to setup mod_register to allow registering accounts using mod_invites. For example:
listen:
  - port: 5443
    ip: "::"
    module: ejabberd_http
    tls: true
    request_handlers:
      /invites: mod_invites
      /share: mod_http_fileserver

 modules:
  mod_http_fileserver:
    docroot:
      /share: /usr/share/javascript
  mod_invites:
    access_create_account: configure
    landing_page: auto
  mod_register:
    allow_modules:
      - mod_invites
-
There are many ways to generate invitations:
-
Login with an admin account, then you can execute Ad-Hoc Commands like "Invite User" and "Create Account"
-
If
mod_adhoc_api
is enabled, you can execute equivalent API Commands
generate_invite
and
generate_invite_with_username
-
Run those API Commands from the command-line, for example:
ejabberdctl generate_invite localhost
-
All those methods give you an invitation URL that you can send it to the desired user, and looks like
https://localhost:5443/invites/Yrw5nuC1Kpxy9ymbRzmVGzWQ
-
The destination user (or yourself) can visit that invitation URL and follow the instructions to register the account and download a compatible client.
If the user has installed already a compatible XMPP client, you don&apost no need to install JavaScript libraries and setup a landing page. In that case, when generating an invitation you will get only the XMPP URI; when the user opens that URI in a web browser, it will automatically open the XMPP client and the corresponding registration window.
Probably you don&apost want to expose the port directly, then you need to setup Nginx or Apache to act as a "reverse" proxy and change your
landing_page
parameter accordingly, for example just
https://@HOST@/invites/{{ invite.token }}
Notice that the landing page can be fully translated using the existing
ejabberd localization feature
.
SQL table for mod_invites
There is a new table
invite_token
in SQL schemas, used by the new
mod_invites
. If you want to use this module, there are two methods to update the SQL schema of your existing database:
If using MySQL or PosgreSQL, you can enable the option
update_sql_schema
and ejabberd will take care to update the SQL schema when needed: add in your ejabberd configuration file the line
update_sql_schema: true
Notice that support for MSSQL in
mod_invites
has not yet been implemented or tested.
If you are using other database, or prefer to update manually the SQL schema:
-
MySQL singlehost schema:
CREATE TABLE invite_token (
    token text NOT NULL,
    username text NOT NULL,
    invitee text NOT NULL DEFAULT (&apos&apos),
    created_at timestamp NOT NULL DEFAULT CURRENT_TIMESTAMP,
    expires timestamp NOT NULL,
    type character(1) NOT NULL,
    account_name text NOT NULL,
    PRIMARY KEY (token(191))
) ENGINE=InnoDB CHARACTER SET utf8mb4 COLLATE utf8mb4_unicode_ci;

CREATE INDEX i_invite_token_username USING BTREE ON invite_token(username(191));
-
MySQL multihost schema:
CREATE TABLE invite_token (
    token text NOT NULL,
    username text NOT NULL,
    server_host varchar(191) NOT NULL,
    invitee text NOT NULL DEFAULT &apos&apos,
    created_at timestamp NOT NULL DEFAULT CURRENT_TIMESTAMP,
    expires timestamp NOT NULL,
    type character(1) NOT NULL,
    account_name text NOT NULL,
    PRIMARY KEY (token(191)),
) ENGINE=InnoDB CHARACTER SET utf8mb4 COLLATE utf8mb4_unicode_ci;

CREATE INDEX i_invite_token_username USING BTREE ON invite_token(username(191));
-
PostgreSQL singlehost schema:
CREATE TABLE invite_token (
    token text NOT NULL,
    username text NOT NULL,
    invitee text NOT NULL DEFAULT &apos&apos,
    created_at timestamp NOT NULL DEFAULT now(),
    expires timestamp NOT NULL,
    "type" character(1) NOT NULL,
    account_name text NOT NULL,
    PRIMARY KEY (token)
);
CREATE INDEX i_invite_token_username ON invite_token USING btree (username);
-
PostgreSQL multihost schema:
CREATE TABLE invite_token (
    token text NOT NULL,
    username text NOT NULL,
    server_host text NOT NULL,
    invitee text NOT NULL DEFAULT &apos&apos,
    created_at timestamp NOT NULL DEFAULT now(),
    expires timestamp NOT NULL,
    "type" character(1) NOT NULL,
    account_name text NOT NULL,
    PRIMARY KEY (token)
);

CREATE INDEX i_invite_token_username_server_host ON invite_token USING btree (username, server_host);
-
SQLite singlehost schema:
CREATE TABLE invite_token (
    token text NOT NULL,
    username text NOT NULL,
    invitee text NOT NULL DEFAULT &apos&apos,
    created_at timestamp NOT NULL DEFAULT CURRENT_TIMESTAMP,
    expires timestamp NOT NULL,
    type character(1) NOT NULL,
    account_name text NOT NULL,
    PRIMARY KEY (token)
);

CREATE INDEX i_invite_token_username ON invite_token(username);
-
SQLite multihost schema:
CREATE TABLE invite_token (
    token text NOT NULL,
    username text NOT NULL,
    server_host text NOT NULL,
    invitee text NOT NULL DEFAULT &apos&apos,
    created_at timestamp NOT NULL DEFAULT CURRENT_TIMESTAMP,
    expires timestamp NOT NULL,
    type character(1) NOT NULL,
    account_name text NOT NULL,
    PRIMARY KEY (token)
);

CREATE INDEX i_invite_token_username_server_host ON invite_token(username, server_host);
New replaced_connection_timeout toplevel option
The new
replaced_connection_timeout
toplevel option enables new session to wait for termination of session that it replaces.
This should mitigate problems where old session presences unavailable sometimes were delivered after new session sent it&aposs presence available.
Improved mod_http_fileserver docroot option
mod_http_fileserver
is a module to serve files from the local disk over HTTP, useful if you just want to serve some HTML or binary files that don&apost need PHP, and don&apost need to setup or configure a separate full-blown web server.
Now the
docroot
option may be a map of paths to serve, allowing this module to serve several paths with different directories for different purposes.
For example, let&aposs serve some public content from
/var/service/www
, also shared JavaScript libraries, and for base URL let&aposs serve from
/var/www
:
listen:
  -
    port: 5280
    module: ejabberd_http
    request_handlers:
      /pub/content: mod_http_fileserver
      /share: mod_http_fileserver
      /: mod_http_fileserver
modules:
  mod_http_fileserver:
    docroot:
      /pub/content: /var/service/www
      /share: /usr/share/javascript
      /: /var/www
Notice that ejabberd includes many modules that serve web services, that may be useful to save you from setting up a full-blown web server, see
ejabberd_http
.
Supported XEP versions
ejabberd supports close to 90
XMPP extension protocols (XEPs)
, either directly implemented in ejabberd source code, in the
libraries
that implement many of the internal features, or in other ejabberd modules available in other repositories like
ejabberd-contrib
.
Those XEPs are updated regularly to bring major improvements, minor changes, fixing typos, editorial or cosmetic changes... and this requires a regular review of those XEP updates in the software implementations to keep them up to date, or at least to document what exact version of the protocols are implemented.
In this sense, we have reviewed all the XEP versions that ejabberd and erlang
xmpp
library were not up-to-date, and have identified which ones are already up-to-date in their DOAP files. Now the pages at XMPP.org describe more accurately the supported protocol versions, see
ejabberd at XMPP.org
and
erlang-xmpp at XMPP.org
.
Erlang, Elixir and Container
ejabberd can be compiled with
Erlang/OTP
from 25.0 up to the latest 28.3.1. Regarding
Elixir
support, ejabberd supports from Elixir 1.14.0 up to the latest 1.19.5
Right now ejabberd compiles correctly with Erlang/OTP from
git
development branch and Elixir 1.20.0-RC1, so hopefully compatibility with the upcoming Erlang/OTP 29 and Elixir 1.20 will be easily achievable.
Binary installers
and the
ejabberd
container now include Erlang/OTP 28.3.1 instead of 27.3, and Elixir 1.19.5 instead of 1.18.4.
Speaking of the
container images
, both
ejabberd
and
ecs
bring other minor changes: they expose more
ports
: 5478 UDP (STUN service), 7777 (SOCKS5 file transfer proxy) and 50000-50099 UDP (TURN service).
The container images in their
ejabberd.yml
file use new macros
PORT_TURN_MIN
,
PORT_TURN_MAX
, and
STARTTLS_REQUIRED
that you can setup easily without modifying
ejabberd.yml
, see
macros in environment
.
Improved ERL_DIST_PORT
ejabberd uses
Erlang Distribution
in the
ejabberdctl
shell script and also for building a cluster of ejabberd nodes.
That Erlang Distribution has historically used the
epmd
program to assign listening ports and discover ports of other nodes to connect. The problems of using epmd are that:
-
epmd
must be running all the time in order to resolve name queries
-
epmd
listens in port
4369
-
the ejabberd node listens in a random port number
How to avoid
epmd
since Erlang/OTP 23.1 and ejabberd 22.10 ? Simply set the
ERL_DIST_PORT
environment variable in the
ejabberdctl.cfg
file:
ERL_DIST_PORT=5210
Since now,
ejabberdctl
passes arguments to Erlang to listen for erlang distribution connections in TCP port 5210, and establish erlang distribution connections to remote ports 5210. That way you know exactly, in advance, what port number to open in the firewall or container.
This ejabberd release introduces some small improvements that facilitate using the
ERL_DIST_PORT
environment variable:
-
ejabberdctl
prints an informative message when it detects that there may be a port number collision, which may happen if you start several ejabberd nodes in the same machine listening in the same
ERL_DIST_PORT
and same
INET_DIST_INTERFACE
.
-
When ejabberd is starting, now it prints the address and port number where it listens for erlang distribution:
[info] ejabberd 26.01 is started in the node ejabberd@localhost in 1.90s
[info] Elixir 1.19.4 (compiled with Erlang/OTP 28)
[info] Erlang/OTP 29 [DEVELOPMENT] [erts-16.2] [source] [64-bit] [smp:4:4] [ds:4:4:10] [async-threads:1] [jit:ns]

[info] Start accepting TCP connections at 0.0.0.0:5210 for erlang distribution
[info] Start accepting TCP connections at [::]:5222 for ejabberd_c2s
[info] Start accepting TCP connections at [::]:5269 for ejabberd_s2s_in
...
-
A new
make relivectl
is introduced, which uses
ejabberdctl
script to start ejabberd (not like
make relive
), and starts ejabberd immediately without building a release (not like
make dev
).
-
The ejabberd Documentation site has improved and updated pages about
Security
,
Erlang Distribution
, and
Clustering
.
New make relivectl
make relive
was
introduced in ejabberd 22.05
. It allows to start ejabberd in path
_build/relive/
without installing it, by using
rebar3 shell
and
mix run
. It automatically compiles code at start and
recompiles changed code at runtime
. But it doesn&apost use the
ejabberdctl
script, and doesn&apost read
ejabberdctl.cfg
, this means that depending on what you are testing, it may not be useful and you had to switch to
make dev
.
A new
make
target is now introduced:
make relivectl
. This is similar, as it starts ejabberd without requiring installation, using path
_build/relivectl/
to store the configuration, database and log files. The benefit over
relive
is that
relivectl
uses
ejabberdctl
and reads
ejabberdctl.cfg
. The drawback is that it doesn&apost recompile code automatically. The benefit over
make dev
is that
relivectl
doesn&apost build an OTP release, so it&aposs faster to start.
Let&aposs summarize all the
make
targets related to installation to determine their usage differences:
make ...
|
install
|
install-rel
|
prod
|
dev
|
relivectl
|
relive
|
|
Writes files in path
|
/
|
/
|
_build/
prod/
|
_build/
dev/
|
_build/
relivectl/
|
_build/
relive/
|
|
Installs
|
✅
|
✅
|
manually uncompress
*.tar.gz
|
-
|
-
|
-
|
|
Uninstall with
|
uninstall
⚠️
incomplete
|
uninstall-rel
✅
|
manual remove
|
-
|
-
|
-
|
|
Start tool
|
ejabberdctl
|
ejabberdctl
|
ejabberdctl
|
ejabberdctl
|
ejabberdctl
|
rebar3/mix
|
Reads
ejabberdctl.cfg
|
✅
|
✅
|
✅
|
✅
|
✅
|
❌
|
|
Recompiles
|
-
|
✅
|
✅
|
✅
|
❌
|
✅
|
|
Starts ejabberd
|
-
|
-
|
-
|
-
|
✅
|
✅
|
|
Recompiles at runtime
|
-
|
-
|
-
|
-
|
❌
|
✅
|
|
Execution time (s.)
|
13
|
40
|
57
|
35
|
4
|
9
|
As seen in the table,
make install / uninstall
seem unnecessary nowadays, because
install-rel / uninstall-rel
allow to install and uninstall correctly all the files. Maybe in the future the implementation of
make install / uninstall
could get replaced with
make install-rel / uninstall-rel
...
In the same sense,
make dev
now apparently falls short between
make prod
(which is absolutely indispensable to build a full OTP release) and
make relive/relivectl
(useful, featureful, and fast for development and testing purposes).
WebAdmin Menu Links
Do you remember that
ejabberd 25.07 introduced
a link in WebAdmin to the local Converse.js page in the left menu when the corresponding
mod_conversejs
is enabled?
Technically speaking, until now the WebAdmin menu included a link to the first
request_handler
with
mod_conversejs
that the admin configured in
ejabberd.yml
. That link included the authentication credentials hashed as URI arguments if using HTTPS. Then
process/2
extracted those arguments and passed them as autologin options to Converse.
From now,
mod_conversejs
automatically adds a
request_handler
nested in WebAdmin subpath. The WebAdmin menu links to that converse URI; this allows to access the HTTP auth credentials, no need to explicitly pass them.
process/2
extracts this HTTP auth and passes autologin options to Converse. Now scram password storage is supported too.
In practice, what does all that mean? Just enable the
mod_conversejs
module, and WebAdmin will have a private Converse URL for the admin, linked in the WebAdmin menu, with autologin. No need to setup a public
request_handler
!
For example, let&aposs configure conversejs only for admin usage:
listen:
  -
    port: 5443
    module: ejabberd_http
    tls: true
    request_handlers:
      /admin: ejabberd_web_admin
      /ws: ejabberd_http_ws

modules:
  mod_conversejs:
    conversejs_resources: "/home/conversejs/12.0.0/dist"
Of course, you can setup a public
request_handler
and tell your users to access the corresponding URL:
listen:
  -
    port: 5443
    module: ejabberd_http
    tls: true
    request_handlers:
      /admin: ejabberd_web_admin
      /public/web-client: mod_conversejs
      /ws: ejabberd_http_ws

modules:
  mod_conversejs:
    conversejs_resources: "/home/conversejs/12.0.0/dist"
With that configuration, what is
the corresponding URL
?
Login to the WebAdmin and look at the left menu: now it displays links to all the configured HTTP services:
ejabberd_captcha
,
ejabberd_oauth
,
mod_conversejs
,
mod_http_fileserver
,
mod_register_web
. Also
mod_muc_log_http
and
mod_webpresence
from
ejabberd-contrib
show links in the WebAdmin left menu. Additionally, the menu shows a lock if the page is encrypted HTTPS, and an
!
if it is not.
Acknowledgments
We would like to thank the contributions to the source code, documentation, and translation provided for this release by:
And also to all the people contributing in the ejabberd chatroom, issue tracker...
Improvements in ejabberd Business Edition
Customers of the
ejabberd Business Edition
, in addition to all those improvements and bugfixes, also get the following changes:
-
New module
mod_push_gate
that can act as target service for
mod_push
, and which can deliver pushes using configured mod_gcm or mod_applepush instances.
-
New module
mod_push_templates
that can be used to have different push notifications for message class matching configured data patterns.
-
New database conversion routines targeting p1db backends
ChangeLog
This is a more complete list of changes in this ejabberd release:
Compile and Start
-
Remove dependencies, macros and code for Erlang/OTP older than 25
-
Require Elixir 1.14 or higher, that&aposs the lowest we can test automatically
-
ejabberdctl
: Support NetBSD and OpenBSD
su
(
#4320
)
-
ejabberdctl.template
: Show meaningful error when
ERL_DIST_PORT
is in use
-
ejabberd_app
: Print address and port where listens for erlang node connections
-
Makefile.in
: Add
make relivectl
similar to
relive
but using
ejabberdctl
Databases
-
Add db_serialize support in mnesia modules
-
Add db serialization to
mod_muc_sql
-
New database export/import infrastructure
-
Add commands for new database export/import
-
Apply timestamp pass in
?SQL_INSERT
queries
-
Update p1_mysql to bring fix for timestamp decoding
-
Extend timestamp type handling in sql macros
-
Revert changes to conversion of pgsql
int
types
Installer and Container
-
make-binaries
: Bump Erlang/OTP 28.3.1 and Elixir 1.19.5
-
Dockerfile
: Bump Erlang/OTP 28.3.1 and Elixir 1.19.5
-
Dockerfile
: Expose also port 7777 for SOCKS5
-
Dockerfile
: Configure TURN ports and expose 5478 50000-50099
-
Dockerfile
: Try to fix error with recent
freetds
Alpine package
-
Container: Setup new macro
STARTTLS_REQUIRED
to allow easy disabling
MUC
-
Add
muc_online_rooms_count
API command
-
Set
enable_hats
room option
true
by default
-
Allow vcard queries even when IQ queries are disabled (
#4489
)
-
Announce
stable-id
feature from XEP-0045 1.31, supported since long ago
-
Fix
preload_rooms
in case of SQL database (
#4476
)
-
Run new hooks:
registering_nickmuc
and
registered_nickmuc
(
#4478
)
-
When deleting account, unregister account&aposs nicks in all MUC hosts (
#4478
)
-
mod_muc_log
: Crash in
terminate/2
when stopping module (
#4486
)
-
mod_muc_occupantid
: Keep salt per MUC service, not individual rooms
-
mod_muc_room
: Rewrite hats code that gets xdata values
-
mod_muc_room
: Handle hats without definition (
#4503
)
-
mod_muc_room
: When user has no hats, don&apost store in hats_users
WebAdmin
-
ejabberd_http
: Run new
http_request_handlers_init
fold hook
-
ejabberd_http
: Add helper
get_auto_urls/2
that returns all URLs and TLS
-
ejabberd_web_admin
: Add helper functions
make_menu_system
-
ejabberd_web_admin
: Show menu system only when can view vhosts
-
ejabberd_web_admin
: Pass Level in
webadmin_menu_system_post
and
inside
hooks
-
mod_conversejs
: Improve link to conversejs in WebAdmin (
#4495
)
-
When epmd isn&apost running show explanation in Clustering WebAdmin page
-
Use improved WebAdmin menu system in more modules
-
When building WebAdmin menu system,
{URLPATH}
in link text is substituted
Web Services
-
rest
: Use separate
httpc
profile
-
ejabberd_captcha
: Use
mod_host_meta:get_auto_url/2
-
ejabberd_http
: Support repeated module in request_handlers
-
ejabberd_http
: Get back handling when BOSH or WS are disabled
-
mod_host_meta
: Move
get_url
functions from
mod_host_meta
to
ejabberd_http
-
mod_host_meta
: Allow calling
get_url/2
for other modules, not only WebSocket
-
mod_host_meta
: Cosmetic rename Module to Handler
-
mod_http_upload
: New
content_type
option similar to
mod_http_fileserver
(
#4488
)
-
mod_http_upload
: Pass ServerHost, not Host which may be
"upload.HOST"
-
mod_http_upload
: Amend the fix for #4450 to support IDNA correctly (
#3519
)
-
mod_http_fileserver
: Support map of paths in
docroot
option
-
mod_conversejs
: Add new Conversejs Paths and ContentTypes (
#4511
)
-
mod_conversejs
: Use ContentType functions from
mod_http_fileserver
(
#4511
)
-
Use
/websocket
URL in default configuration like
mod_conversejs
, it&aposs more meaningful
Core and Modules
-
Add
replaced_connection_timeout
toplevel option
-
Fix nasty SSL warnings (
#4475
)
-
ejabberd_commands
: Show meaningul error message when problem executing command (
#4506
)
-
ejabberd_logger
: Append "color clean" only in console template, not file
-
ejabberd_oauth
: Log error if
oauth_list_tokens
executed with unsupported DB (
#4506
)
-
misc
: Get back functions and mark them as deprecated
-
mod_adhoc_api
: Show nice command name, as WebAdmin already does
-
mod_pubsub
: Deliver pubsub notifications to remote servers for nodes with presence based delivery
-
mod_scram_update
: Don&apost hard-code iteration count
-
Bump many XEPs versions that are already supported
-
Improve documentation of
install_contrib_modules
(
#4487
)
Full Changelog
https://github.com/processone/ejabberd/compare/25.10...26.01
ejabberd 26.01 download & feedback
As usual, the release is tagged in the Git source code repository on
GitHub
.
The source package and installers are available in
ejabberd Downloads
page. To check the
*.asc
signature files, see
How to verify ProcessOne downloads integrity
.
For convenience, there are alternative download locations like the
ejabberd DEB/RPM Packages Repository
and the
GitHub Release / Tags
.
The
ecs
container image is available in
docker.io/ejabberd/ecs
and
ghcr.io/processone/ecs
. The alternative
ejabberd
container image is available in
ghcr.io/processone/ejabberd
.
If you consider that you&aposve found a bug, please search or fill a bug report on
GitHub Issues
.


 chevron_right


 ejabberd 26.02